The iPad 3 with it’s new amazing screen will be here soon. I just hope they make it view-able in direct sunlight. My mobile phone uses chunks of metal between each view-able pixel to get around this problem.
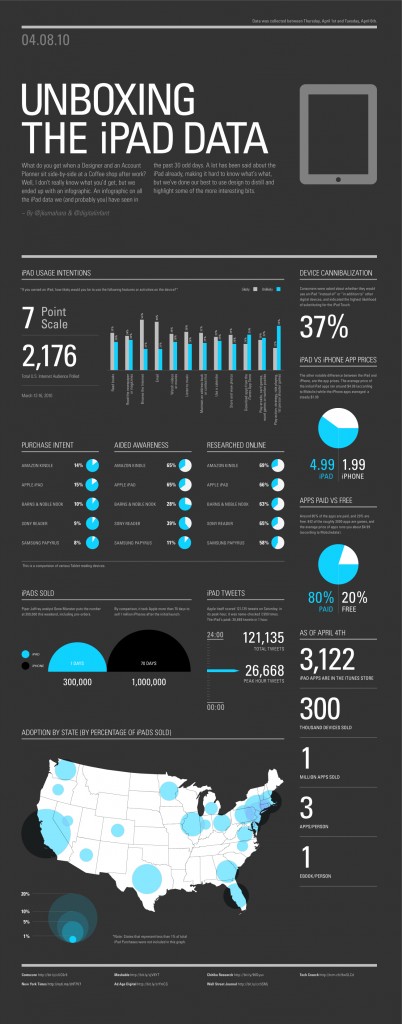
The info graphic below was made by John Kumahara and Johnathan Bonnell. The info graphic contains interesting facts such as usage intention and amount iPad sold compared to the first iPhone.
The majority of users use the iPad to browse the internet, email and read books. Surprisingly only 26% will download (purchase) an app. Although maybe it is not that surprisingly considering an iPad app is an average of three dollars more expensive then an iPhone app. It will be interesting to see Apple’s report later on on how much iPad apps were sold over three months.
I’m starting to really like infographics like these with clear interesting data displayed in a beautiful design. Four weeks ago I also posted an infographic with the facts and figures about Google, which was really clear and informative.
Imagine how great it would be if people made infographics about Macbooks, laptops, blackberry, iPhone, etc. It would be a great aide when researching which product to buy. You will get a clear statistics and spend less hours reading all available reviews and users comment. I hope Jonathan and John will enlighten us with more infographics as nice and informative as this one.
Unboxing the iPad by Jonathan Kumahara and Jonathan Bonnell.
The iPad 2 was released and put in stores ages ago but next the iPad 3 will be out. It is said to have a retina screen and possibly be 3D. I wonder if it will have 2 cameras at the back and on the front.


